Every smear, reviewed in minutes.
SigTuple’s AI-assisted peripheral blood smear console lets a pathologist verify the machine’s read of every cell, correlate it against the CBC, and sign off a confident report, without leaning into a microscope.
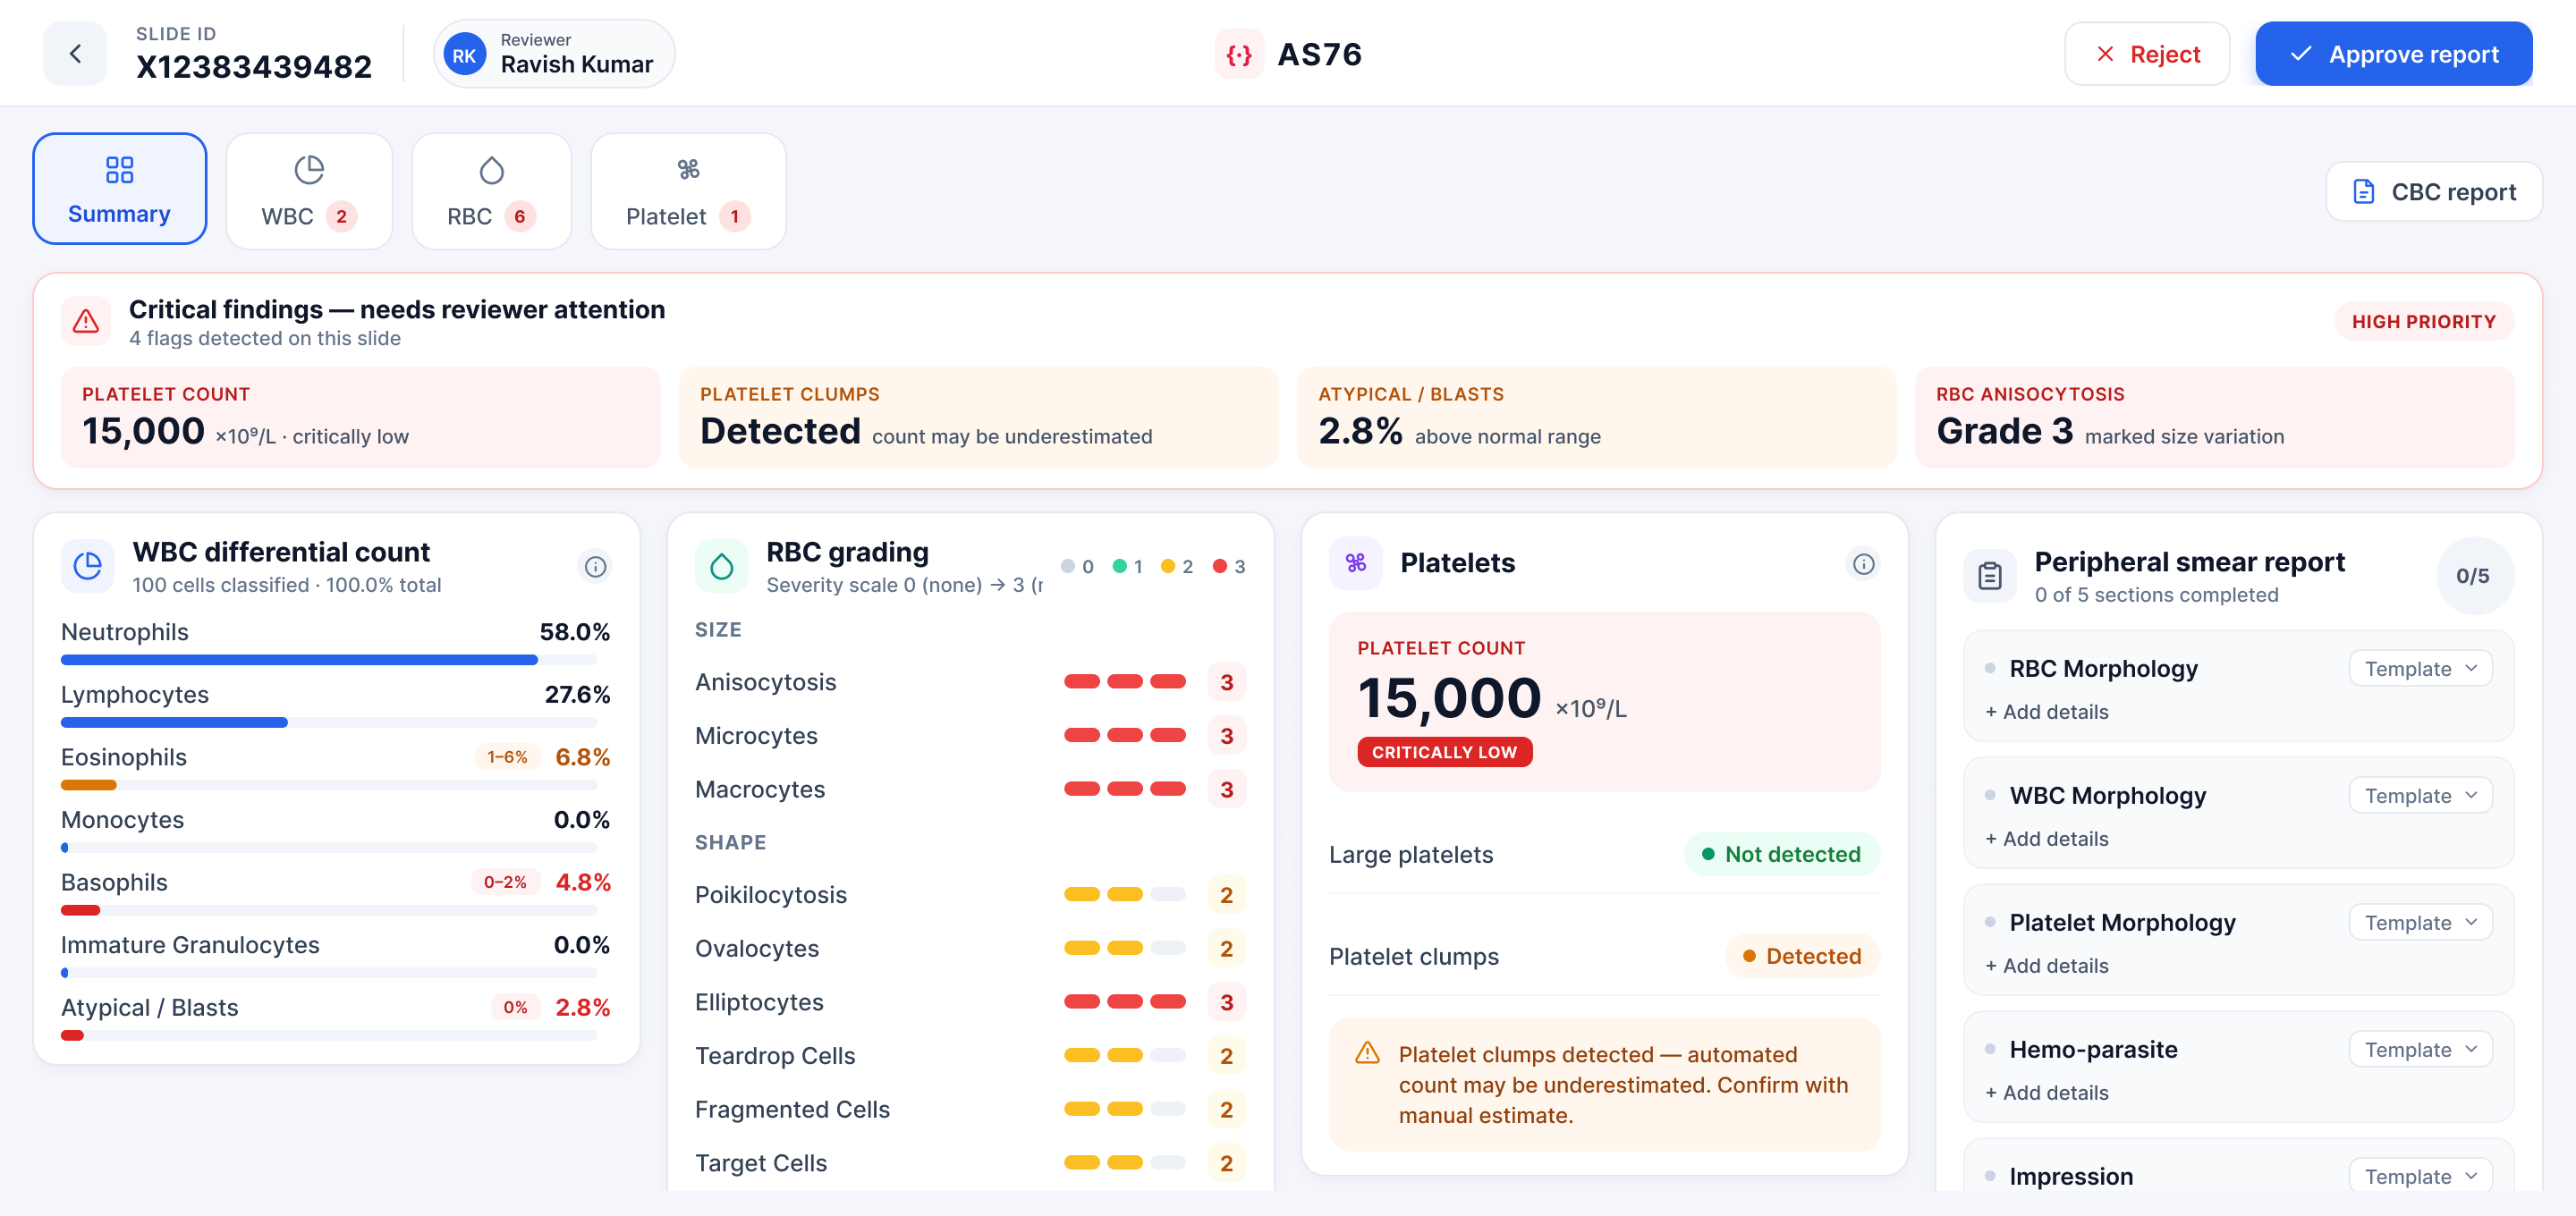
A peripheral blood smear is one of the richest tests in hematology, and one of the slowest. A pathologist hand-counts a hundred white cells, grades red-cell morphology from memory, and estimates platelets field by field.
AS76 does that read in seconds. The hard part was the next step, getting a human to trust it.
Make verification, not data entry, the fastest path. Surface the AI’s findings, flag exactly what needs a second look, and let the reviewer correct, correlate against the CBC, and approve, in the order a hematologist actually thinks, not the order the model outputs.
Outcomes & process
Shadow the scope
We sat beside hematopathologists through real reporting sessions to map how they move from count to sign-off.
Reframe to review
We reframed the task from “enter the counts” to “verify the read,” letting flags decide where attention goes.
Design in lockstep
Parallel tracks for WBC, RBC and platelets, each pressure-tested against patch galleries and live FOV imagery.
Systematise
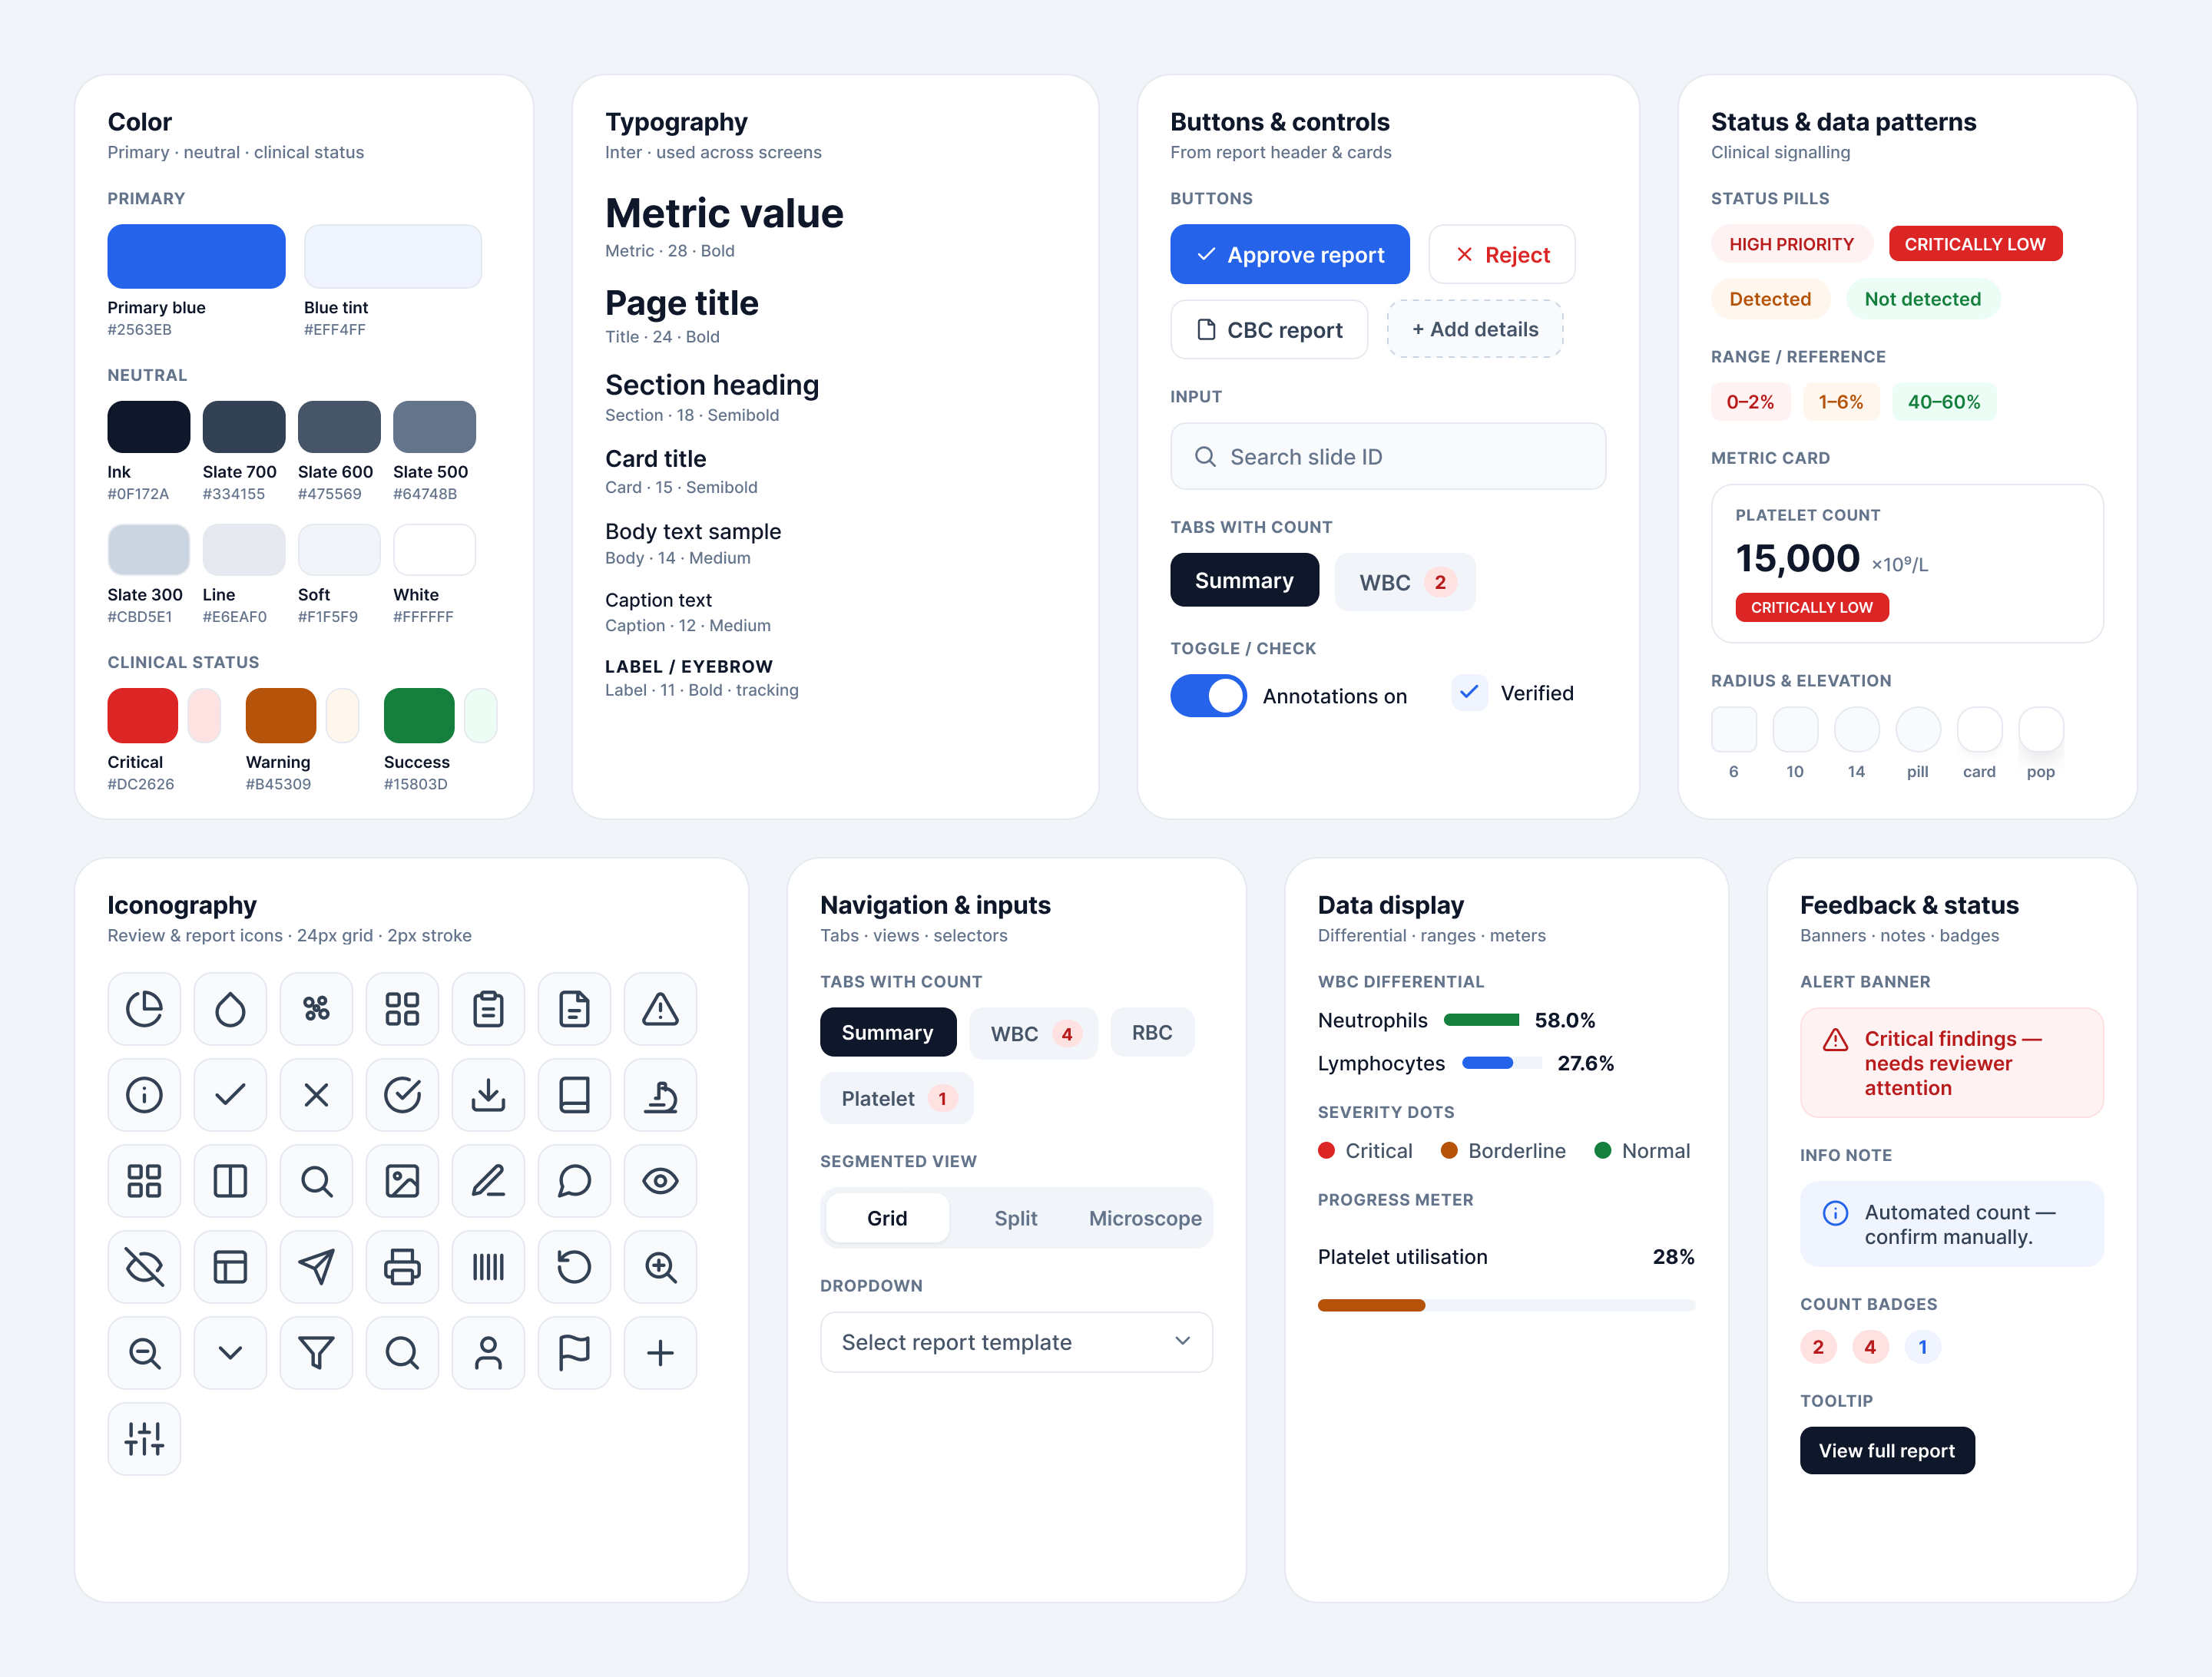
A documented component library and flag language handed to engineering for build and future modules.
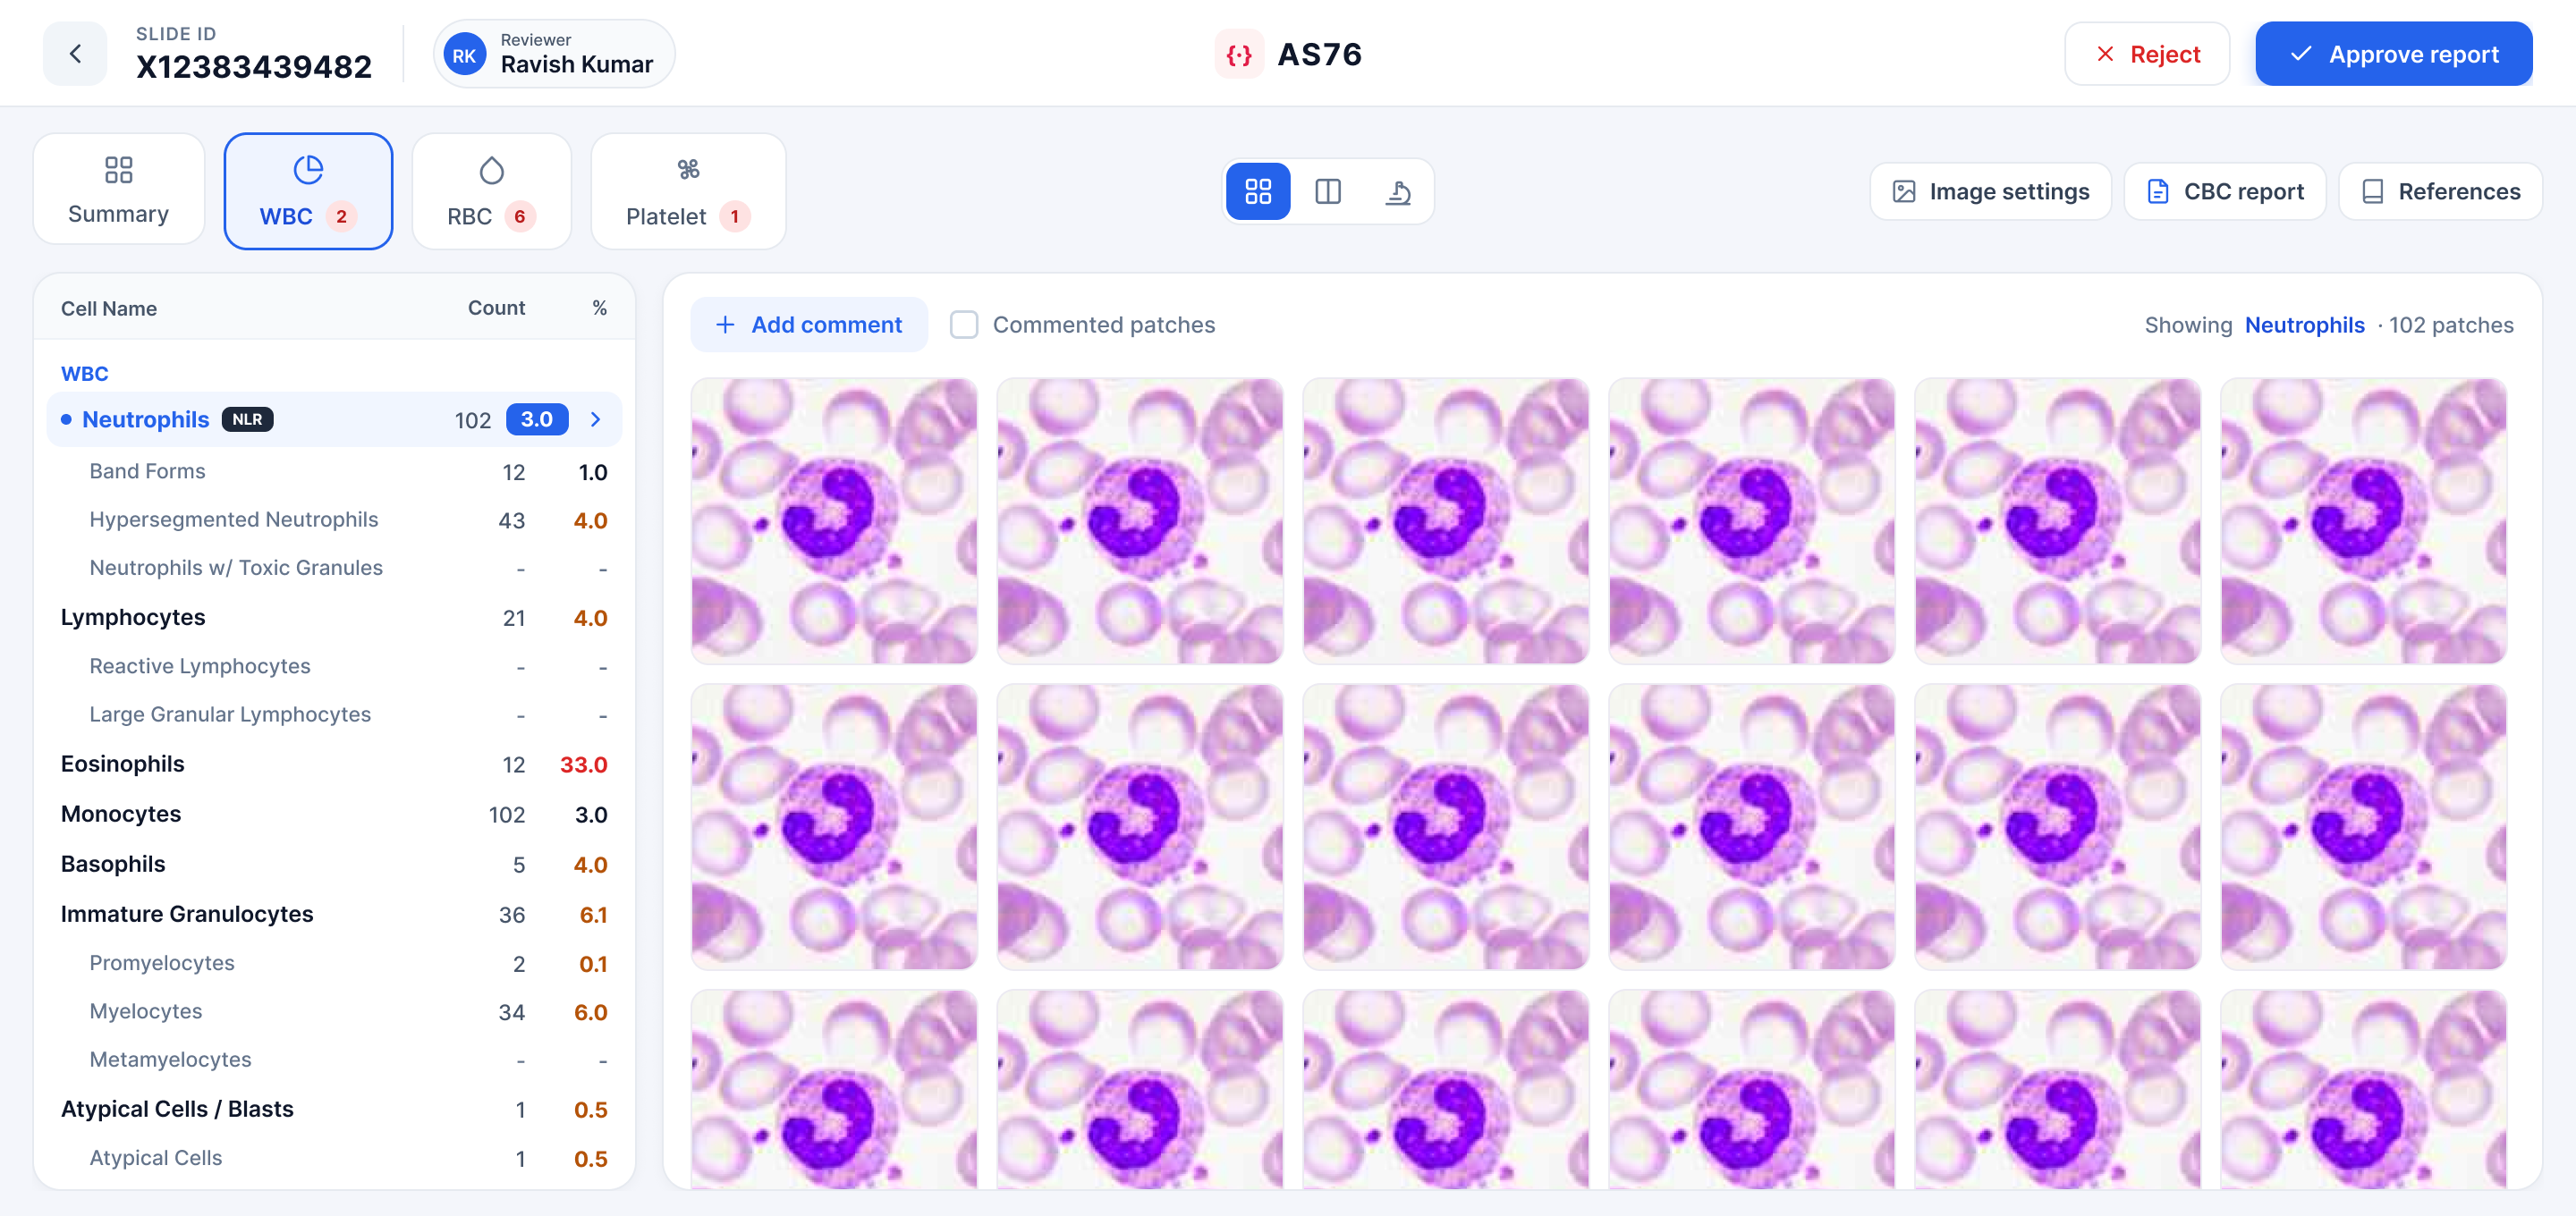
Every cell, a clearly
reviewable patch
The WBC differential presents every classified cell as a reviewable patch, grouped by lineage, with a split view tying the gallery to the whole-slide map.
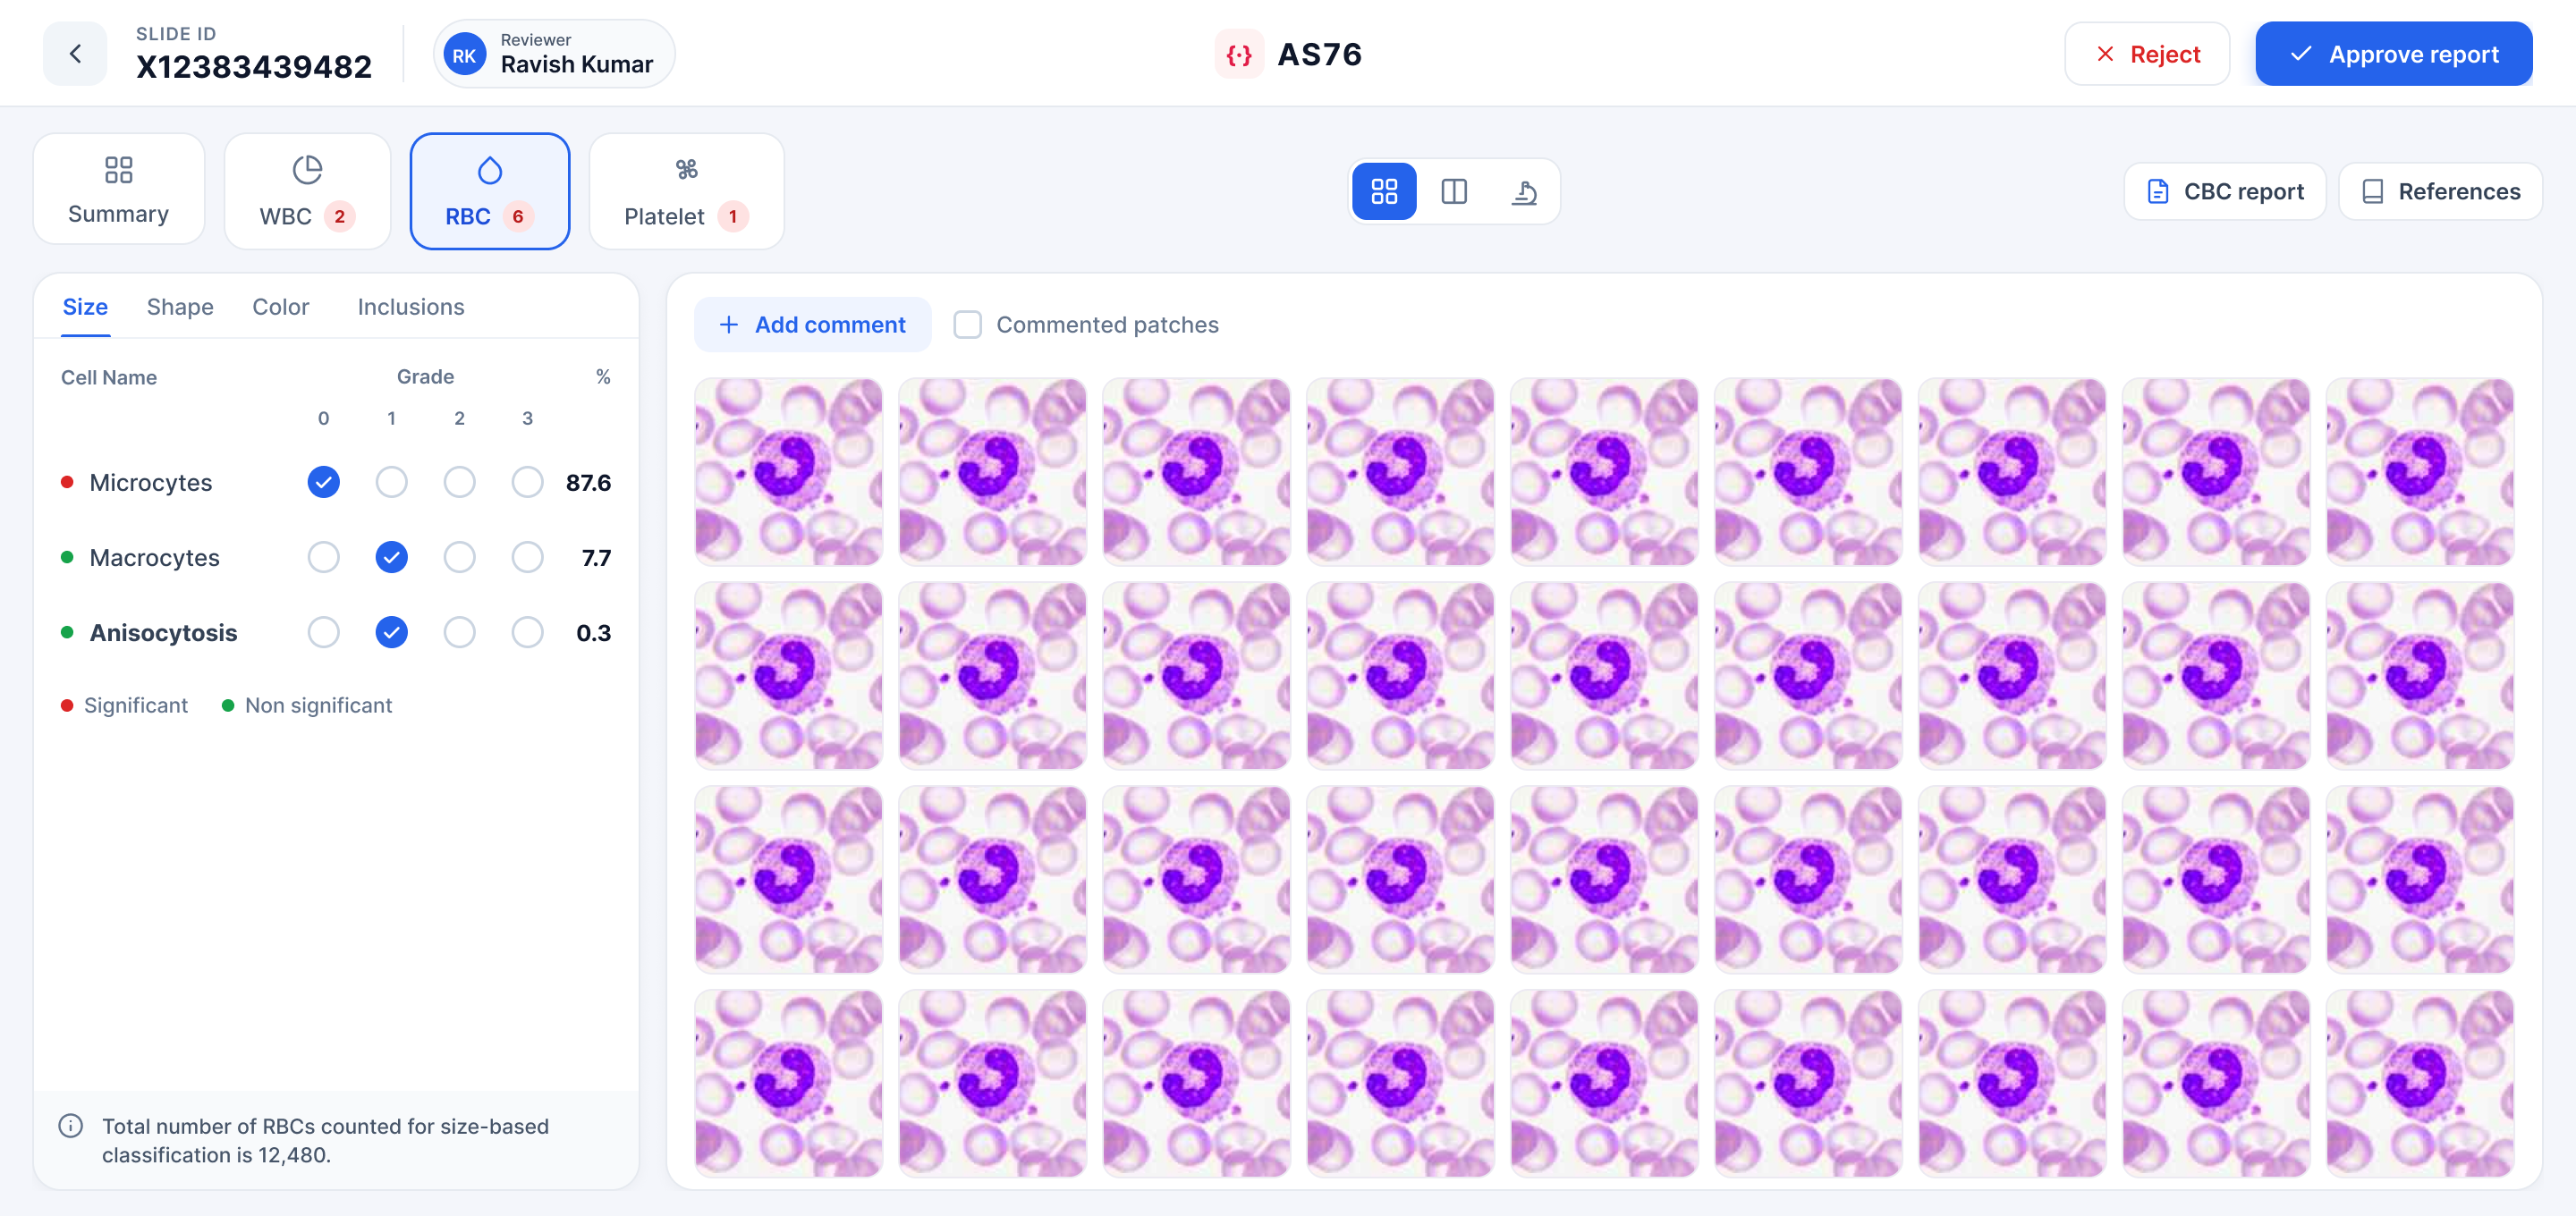
Morphology graded against the evidence
RBC grading scores size, shape, colour and inclusions on a 0–3 severity scale; platelet estimation gives per-FOV counts, an editable factor and clump warnings.
Correlate the smear against the CBC
The CBC report slides in as an overlay so the reviewer can correlate analyser values against the smear’s own WBC, RBC and platelet findings, flagged deltas called out inline.
Pan, zoom and measure the slide
The scope view turns the digitised slide into a microscope, pan, zoom and measure on a 100× field reference, with a minimap to keep your place.
The model’s accuracy was never the question. The question was whether a pathologist could see why to agree with it, fast enough to do it a hundred times a day.
Evidence
Every count is a gallery of real cell patches; the reviewer is never asked to take a number on faith.
Triage
Flags mark only what diverges from normal, and count themselves on the tabs, so attention goes where it matters.
Trust
It doesn’t ask you to count. It asks you to confirm, with every grade backed by the cells it came from.
Inside the reviewer console
One workspace, three reads. Step through the views a pathologist moves through to verify a smear.
Every classified white cell as a reviewable patch, grouped by lineage with sub-types.
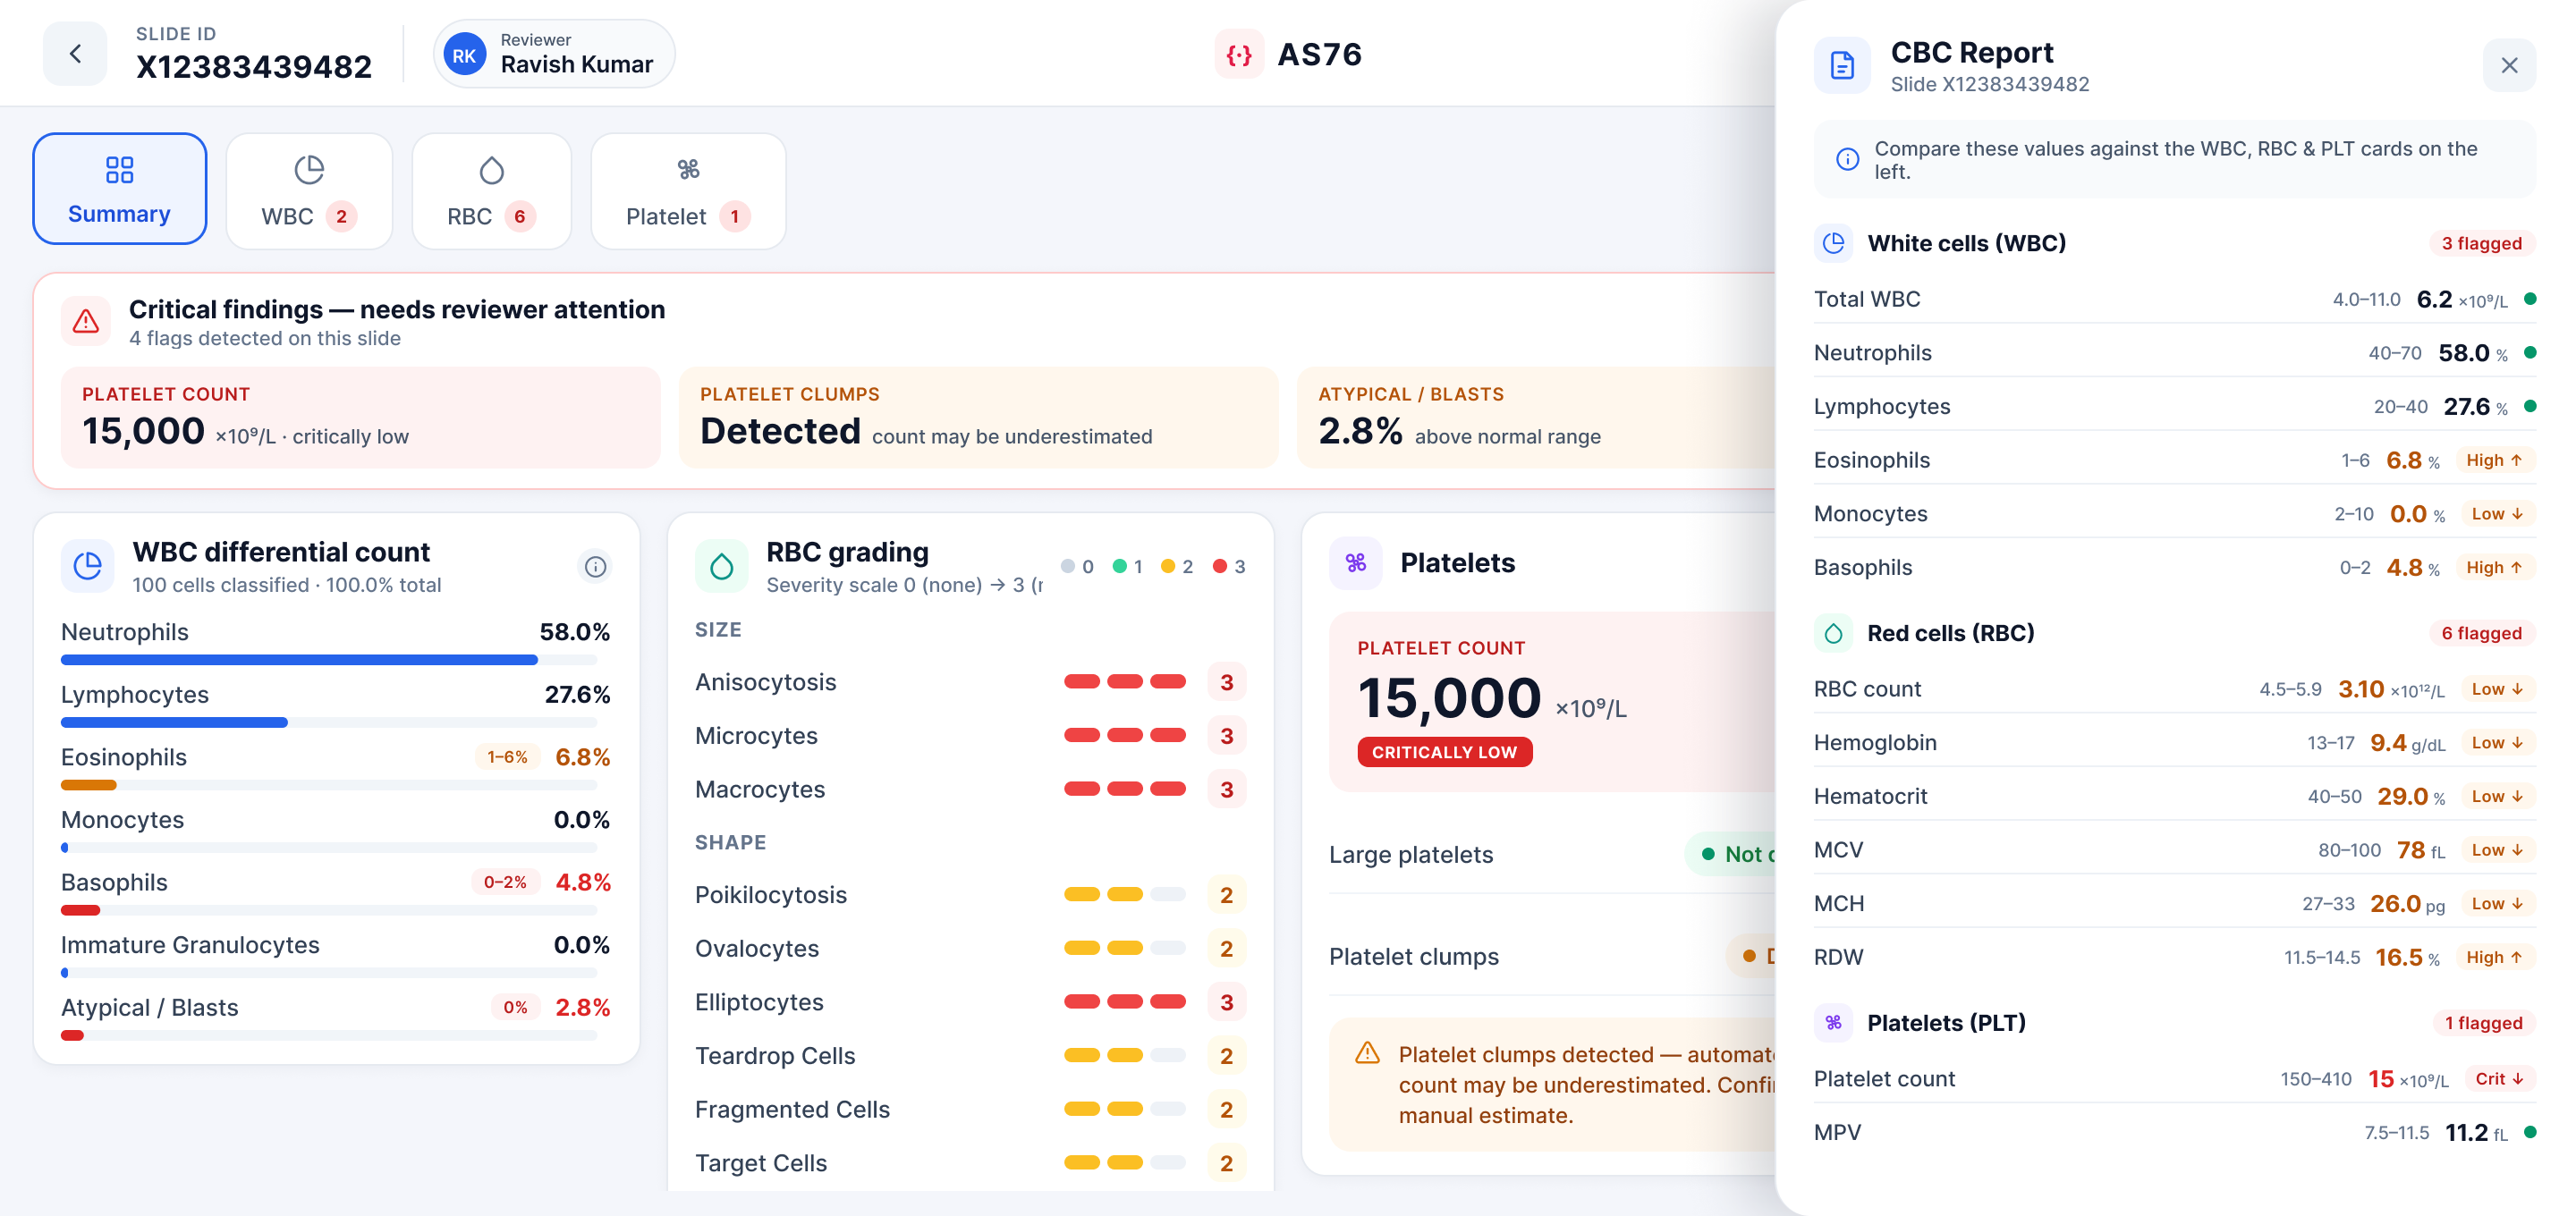
The CBC report slides in as an overlay so analyser values sit beside the smear’s own findings, flagged deltas called out inline for fast correlation.
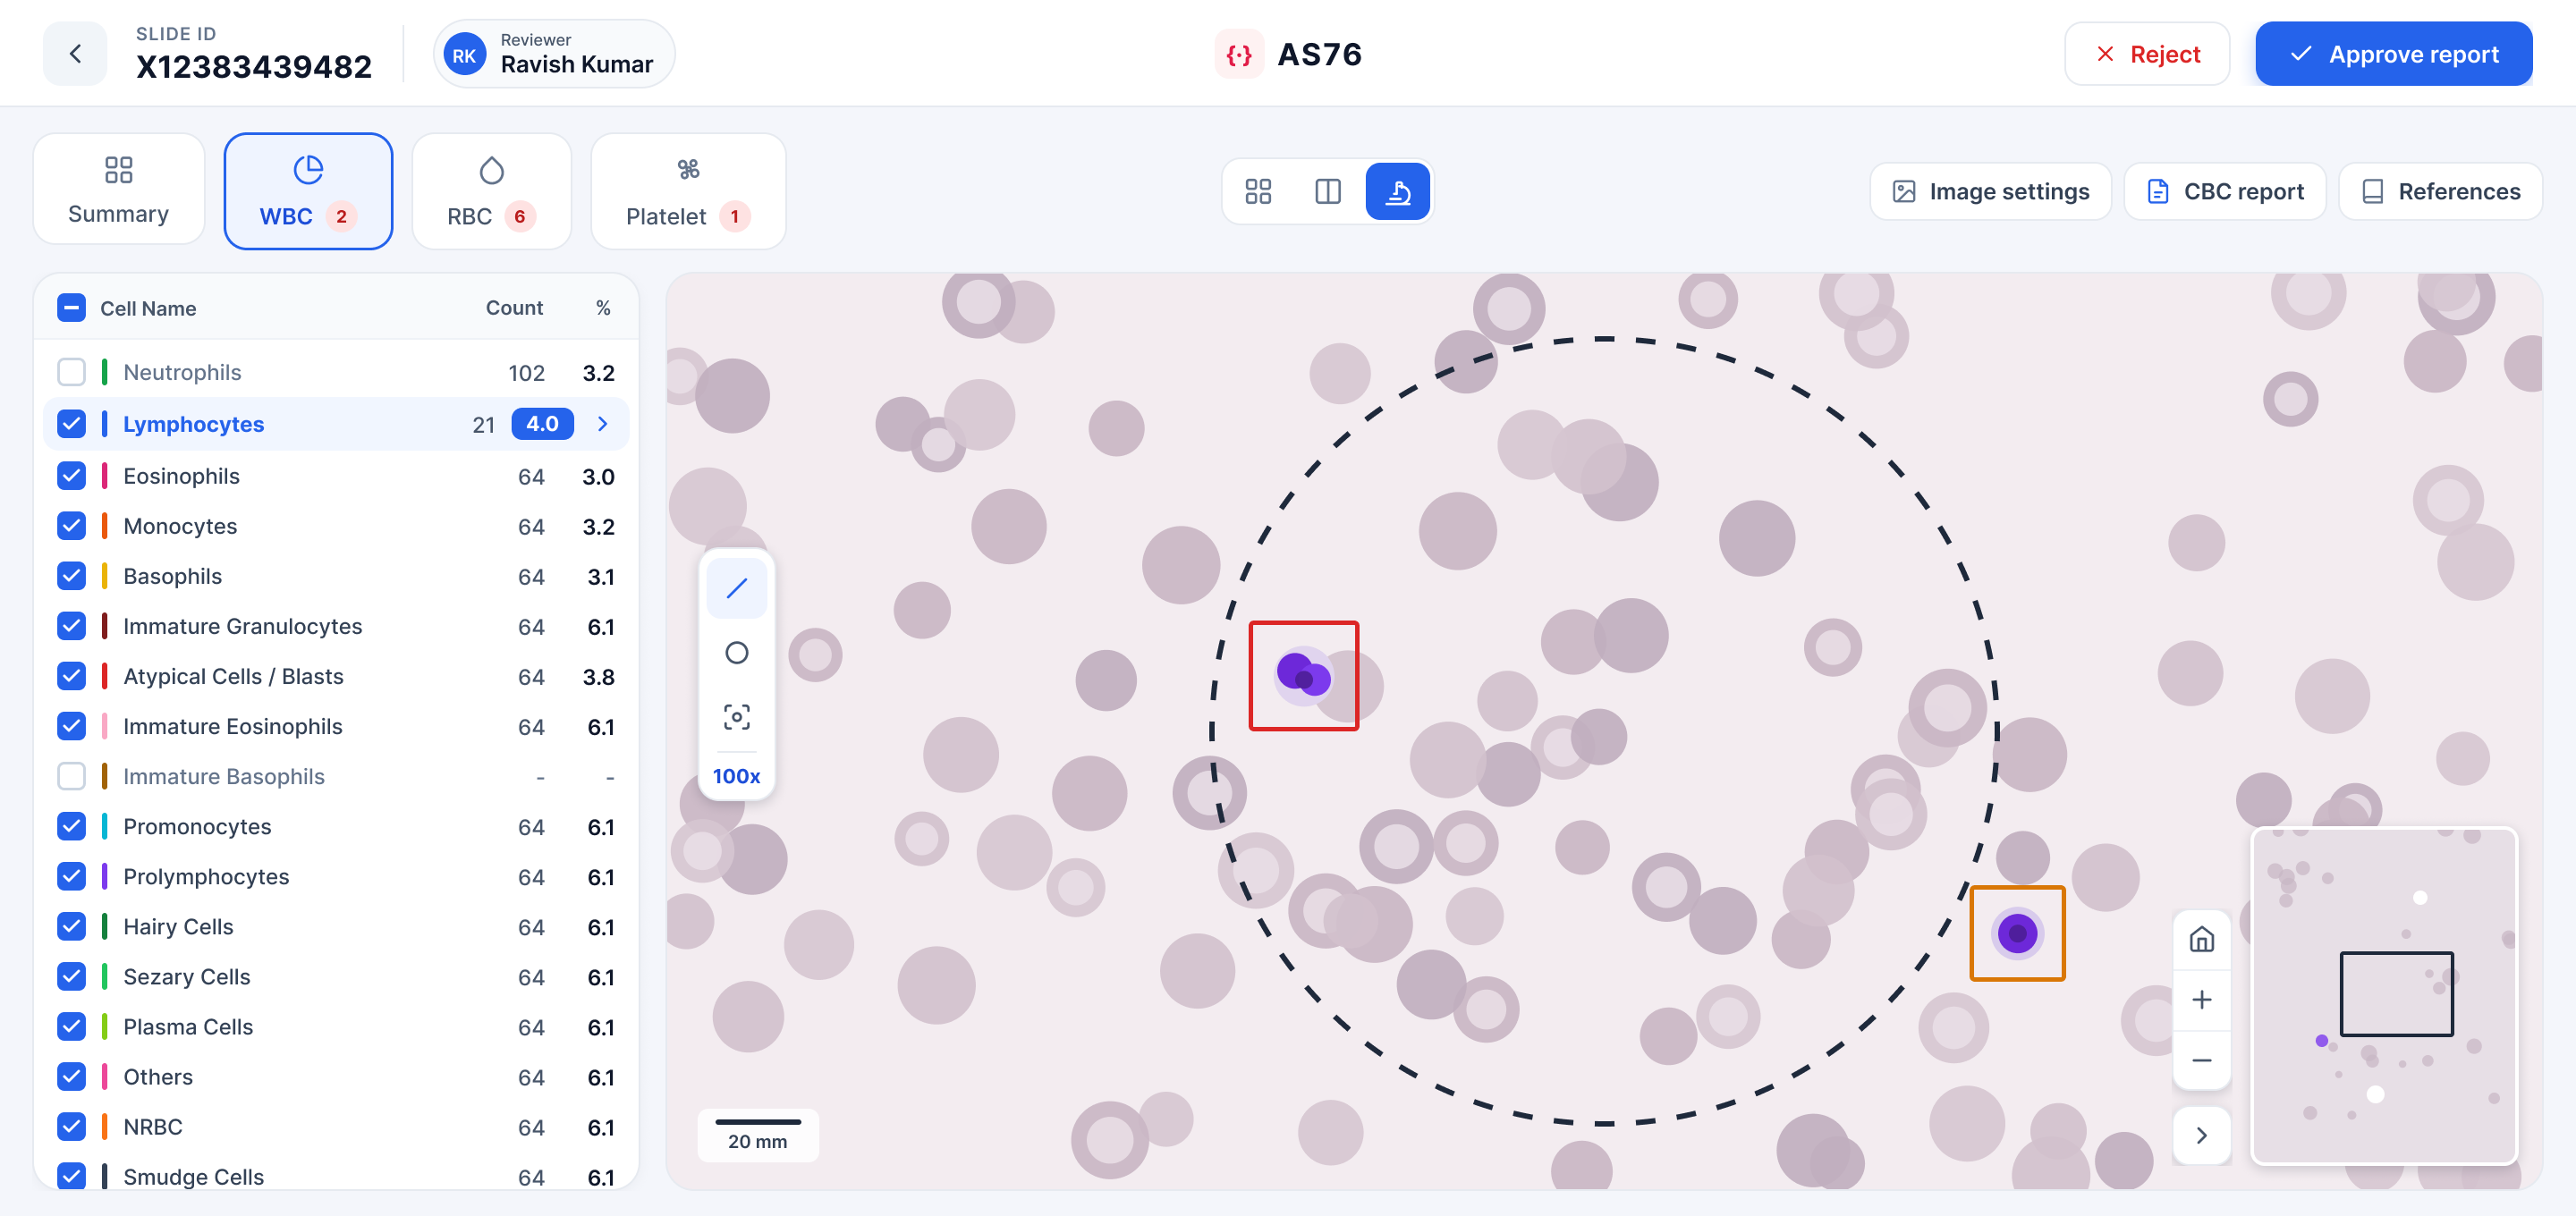
Scope view, pan, zoom and measure on the digitised slide, with a minimap and a 100× field reference to keep your place across the whole smear.
The foundations behind the console
Colour, type, components and clinical-signal patterns, documented so the build stayed consistent across every screen.
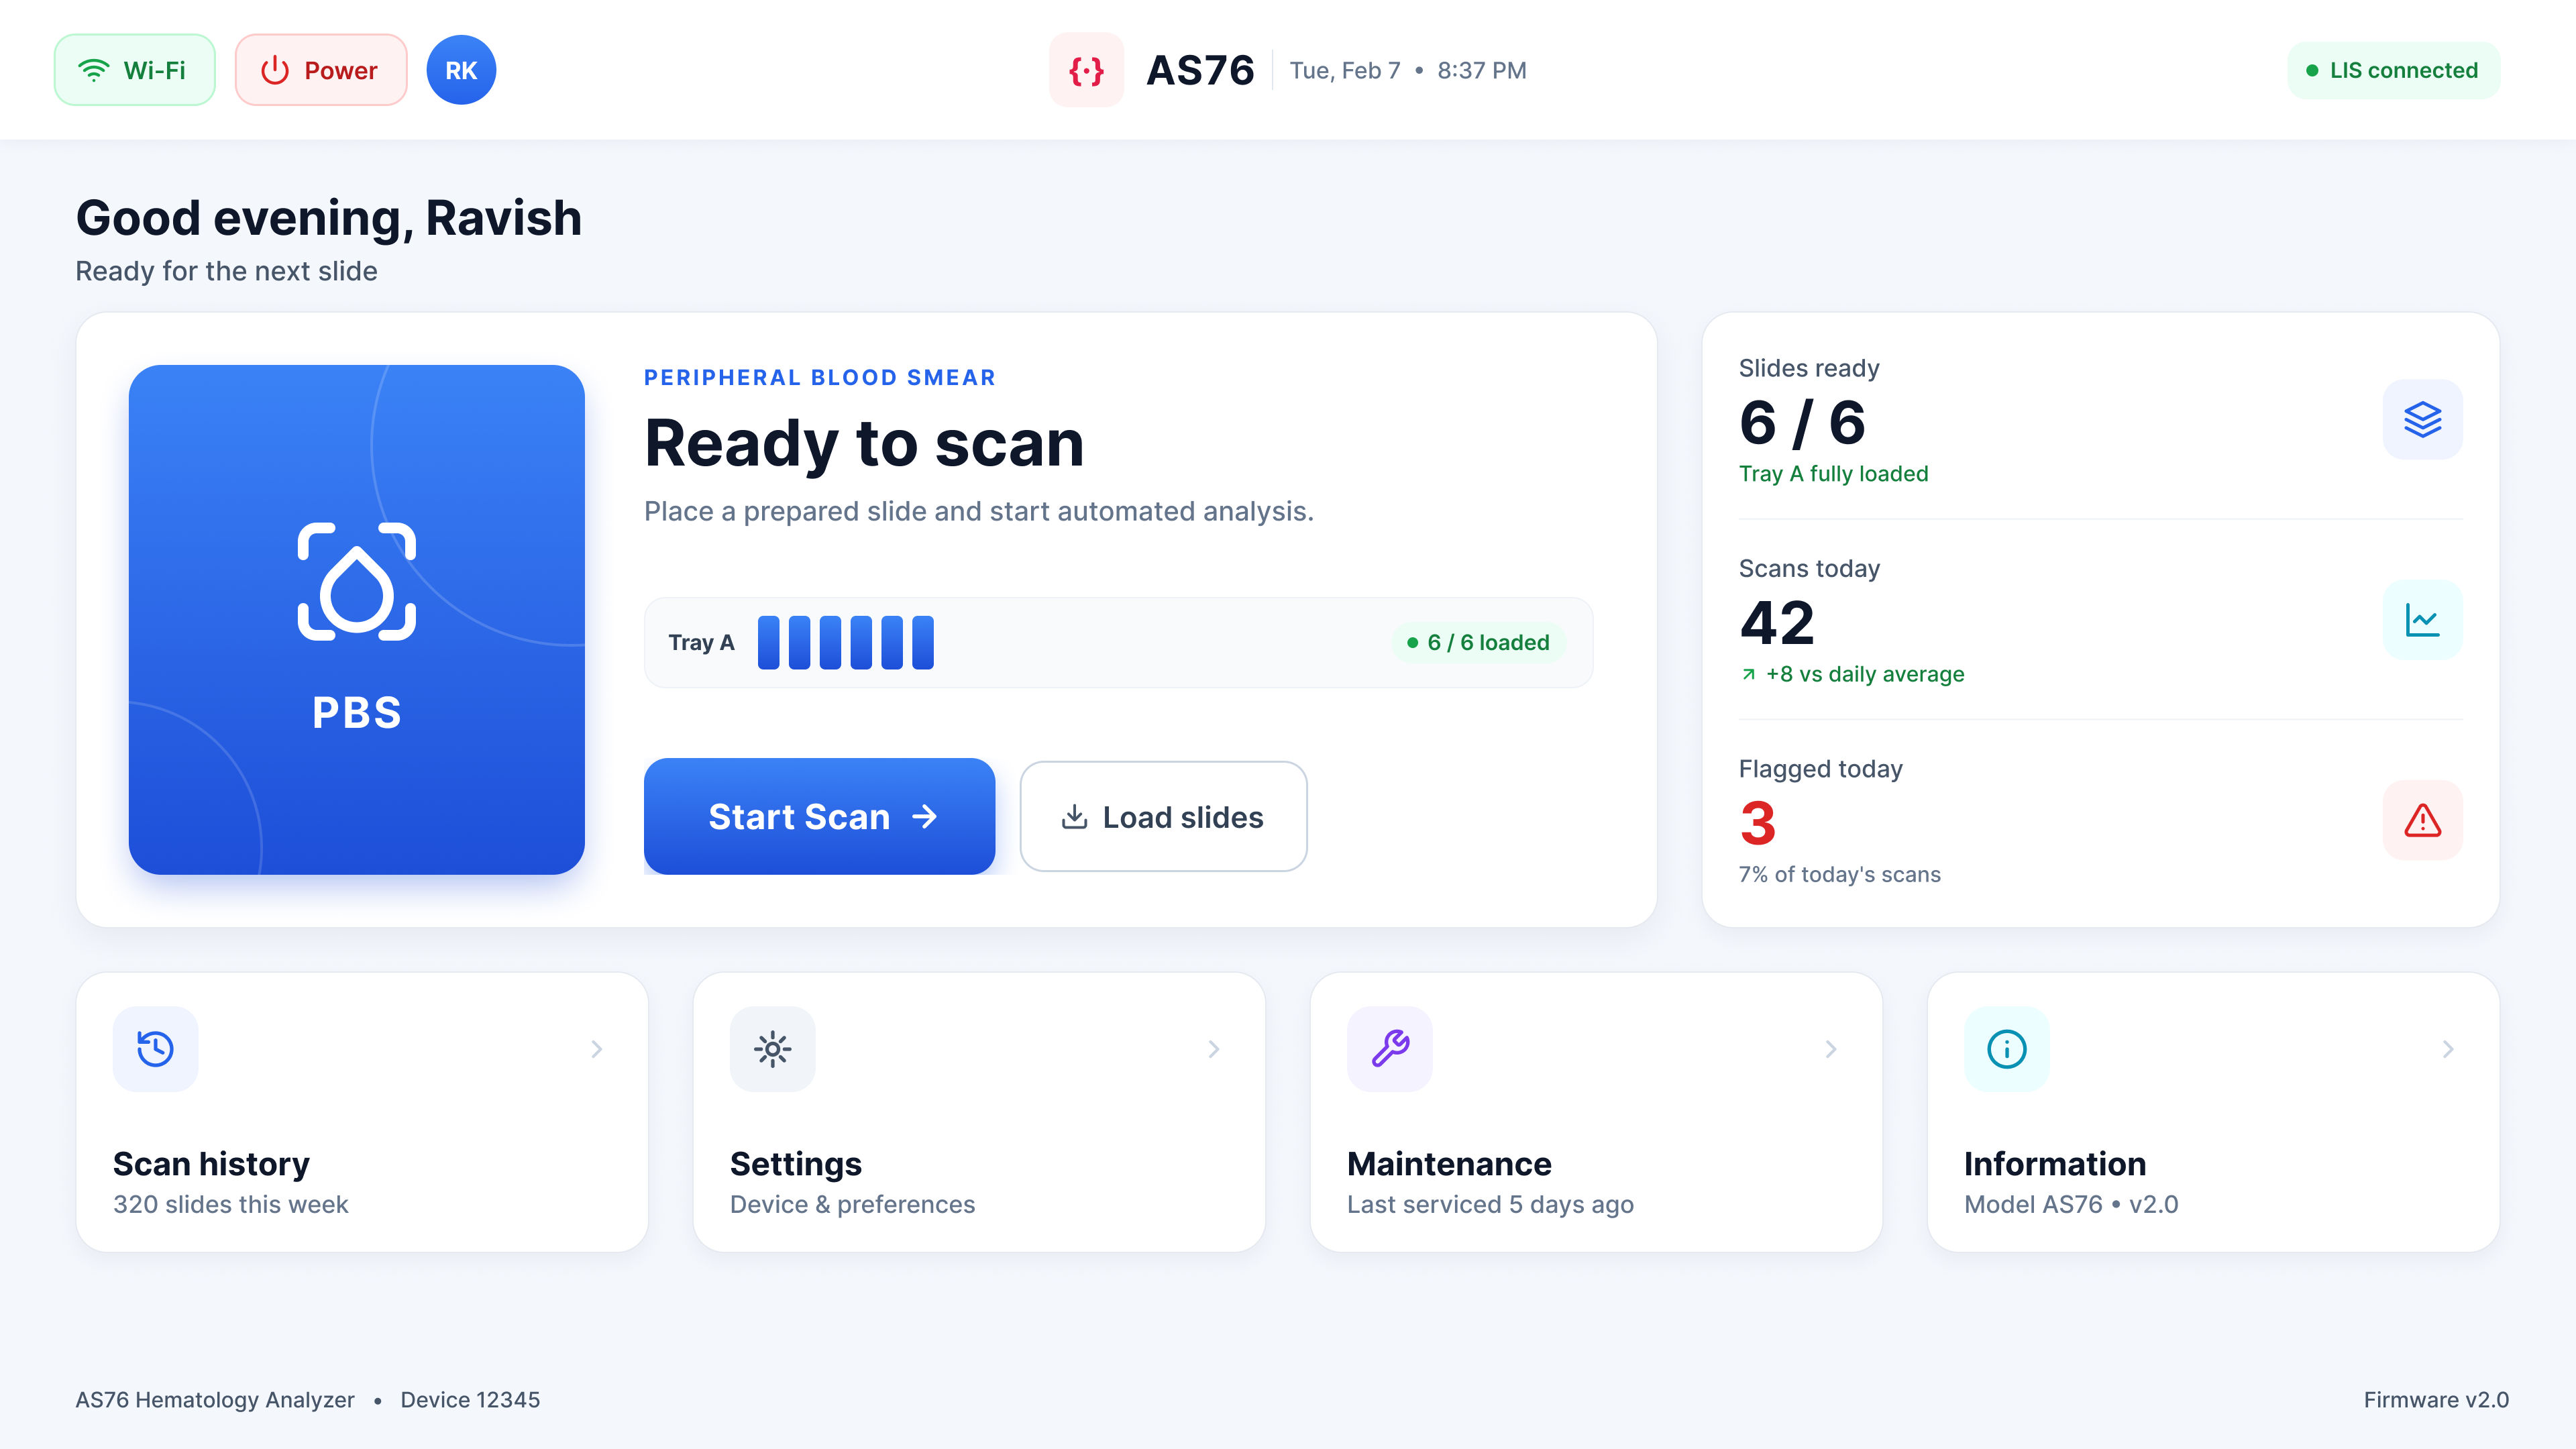
AS76, the analyzer the whole lab can run
 ↗
↗